 Super Real Korean
Overcoming TOPIK Traps 30-Day Project(6) : '숫자놀이' _'number game' traps hidden in the graphs and charts
TOPIK 함정 돌파 30일 작전 (6일차)
Overcoming TOPIK Traps 30-Day Strategy (Day 6): Decoding 'Number Game' Traps[한국어 원문] 오늘은 TOPIK 시험에서 자주 등장하는 그래프나 도표 문제에 숨겨진 '숫자놀이' 함정을 파헤쳐 보겠습니다. 이 유형은 단순한 수치 비교를 넘어서, 비율, 증가/감소폭, 시점 등을 교묘하게 섞어 학습자를 혼란에 빠뜨립니다. 정확한 자료 해석 능력과 함정 포인트를 짚어내는 훈련을 통해 완벽하게 극복할 수 있습니다.
[English Translation] Today, we will delve into the 'number game' traps hidden in the graphs and charts that frequently appear on the TOPIK test. This type of problem goes beyond simple numerical comparisons, cleverly mixing percentages, rates of increase/decrease, and time points to confuse test-takers. You can overcome this challenge perfectly through training that focuses on accurate data interpretation and identifying trap points.
[도표 함정 해독 / Graphic: Decoding Chart & Graph Traps in TOPIK]
실전 문제 풀이 & 함정 분석 (Practice Problems & Trap Analysis)
[세트 1] 한국 대학생의 아르바이트 현황 (Survey on Korean College Students' Part-Time Jobs)
[한국어 원문] 다음은 '한국 대학생의 아르바이트 현황'에 대한 조사 결과이다. 이 내용을 바르게 이해한 것은?
[English Translation] The following is the result of a survey on 'The Status of Part-Time Jobs among Korean College Students.' Which of the following correctly understands this content?
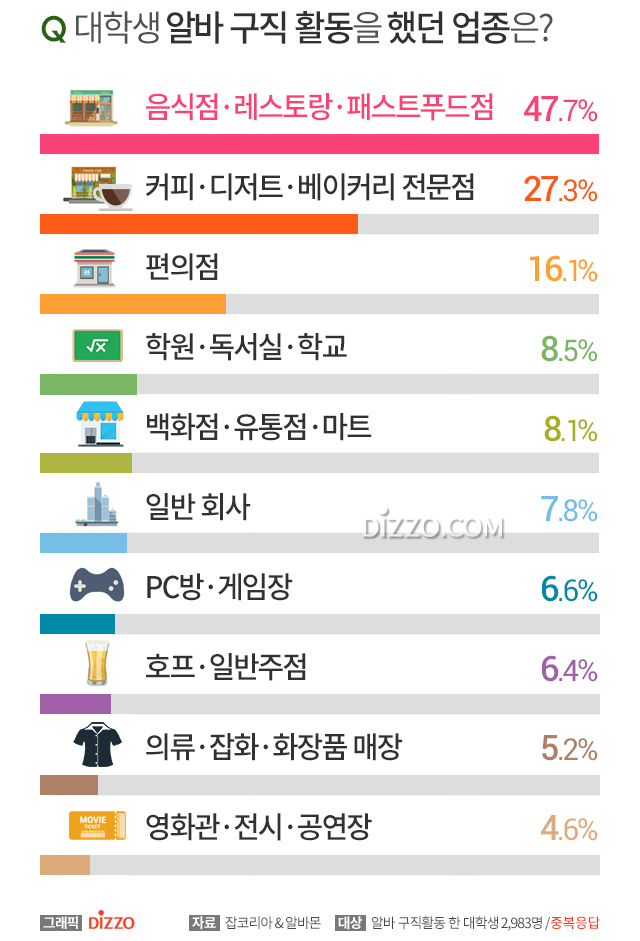
① 아르바이트를 하는 학생들의 수는 작년보다 15% 이상 증가했다.
(The number of students working part-time increased by more than 15% compared to last year.)
② '카페/음식점' 분야에서 일하는 학생들이 가장 많았고, 그중 1/4이 넘는 수가 이 분야에서 일한다.
(The 'Cafe/Restaurant' sector had the highest number of students, with more than 1/4 working in this field.)
③ '편의점'에서 일하는 학생들의 비율은 '사무보조'보다 낮다.
(The percentage of students working at 'Convenience Stores' is lower than that of 'Office Assistants'.)
④ 2024년 대비 2025년에 모든 분야의 아르바이트 비율이 증가했다.
(Compared to 2024, the proportion of part-time jobs increased in all sectors in 2025.)
정답 (Answer): ②
[풀이 / Solution] '카페/음식점' 분야는 40%로 가장 높은 비율을 차지합니다. '그중 1/4이 넘는 수'는 25%를 넘는다는 의미이므로, 40%는 이에 해당합니다. 따라서 이 문장은 정확합니다.
(The 'cafe/restaurant' sector accounts for the highest percentage at 40%. 'More than 1/4' means over 25%, and 40% fits this description. Therefore, this statement is correct.)
[함정 분석 / Trap Point & Analysis]
• ①번: '15% 이상 증가'는 수치(증가율)를 제시하고 있으나, 그래프에는 '아르바이트 비율'만 나와 있을 뿐, 작년 대비 '학생 수'의 증가는 명확히 제시되지 않았습니다. 이는 비율과 absolute수치를 혼동시키는 클래식 함정입니다.
(Statement ① presents a specific growth figure, but the graph only shows 'job proportions,' not the absolute 'number of students' compared to last year. This is a classic trap confusing proportions with absolute counts.)
• ③번: '편의점'은 15%, '사무보조'는 20%로, 편의점 비율이 더 낮으므로 단순 비교는 맞으나 옵션 문맥 해석 오류를 유도하는 단순 수치 확인 문제입니다.
(Statement ③ can be checked easily by direct numerical comparison: convenience store is 15% and office assistant is 20%.)
• ④번: '모든 분야가 증가'했다는 언급은 자료에 나와 있지 않은 지나친 일반화의 함정입니다.
(Statement ④ claims 'all sectors increased,' which is a trap of overgeneralization not supported by data.)
[세트 2] 직장인의 스트레스 원인 (Causes of Workplace Stress)
[한국어 원문] 다음은 '직장인의 스트레스 원인'에 대한 조사 결과이다. 이 내용을 바르게 설명한 것은?
[English Translation] The following is the survey result regarding 'Causes of Stress for Office Workers.' Which of the following correctly explains this content?
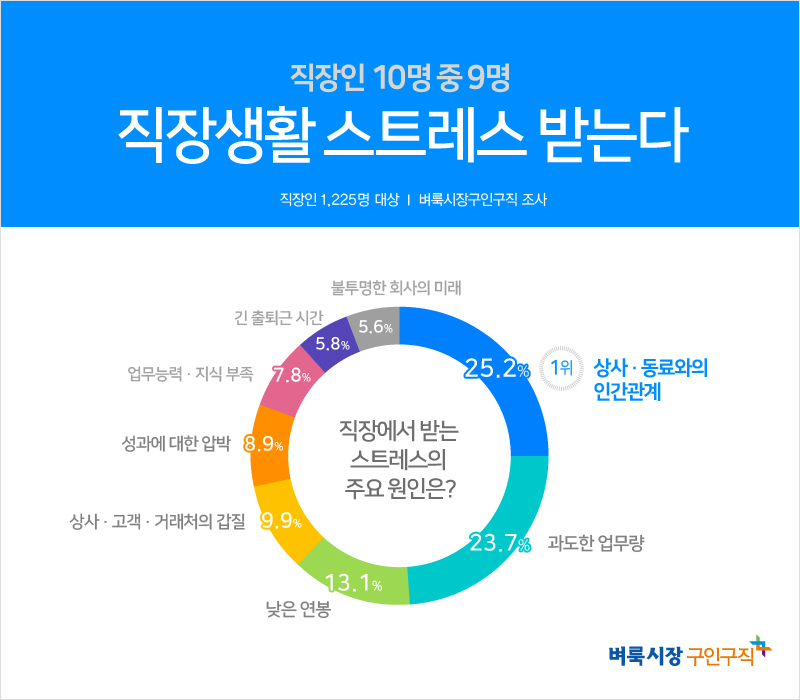
① '업무량'이 스트레스의 가장 큰 원인이었으며, 이는 전체의 절반에 가깝다.
('Workload' was the biggest cause of stress, which is close to half of the total.)
② '인간관계'로 스트레스받는 비율은 '상사와의 관계'보다 낮다.
(The percentage of stress caused by 'Human Relations' is lower than 'Relationships with Boss'.)
③ '임금'과 '승진'은 스트레스 원인 순위에서 최하위를 기록했다.
('Wages' and 'Promotion' recorded the lowest rank in causes of stress.)
④ '업무능력·지식부족'으로 인한 스트레스는 '업무량'의 약 1/3 수준이다.
(Stress caused by 'Lack of Ability/Knowledge' is approximately 1/3 the level of 'Workload'.)
정답 (Answer): ④
[풀이 / Solution] '업무능력·지식부족'은 7.8%이며, '업무량'은 23.7%입니다. 23.7의 약 1/3은 약 7.9%에 해당하므로 '업무능력·지식부족'으로 인한 스트레스가 '업무량'의 약 1/3 수준이라는 설명은 매우 정확합니다.
('Lack of ability/knowledge' is 7.8%, and 'workload' is 23.7%. Since 1/3 of ~23.7 is ~7.9, the statement that stress from ability shortage is about 1/3 of workload is mathematically accurate.)
[함정 분석 / Trap Point & Analysis]
• ①번: '업무량'이 가장 높지만 전체의 23.7% 수준으로 '절반(50%)'에는 턱없이 부족합니다. '절반에 가깝다'는 주관적인 모호한 표현을 집어넣어 착시를 유도하는 함정입니다.
(Statement ① claims it is 'close to half (50%),' but 23.7% is nowhere near 50%. This trap uses subjective vague phrases like 'close to half' to deceive test-takers.)
• ②번: 유사 항목 간의 비율을 반대로 비교하거나 다수의 항목을 묶어 착시를 일으키는 오답 함정입니다.
(Statement ② reverses the comparison between similar category items to create confusion.)
• ③번: 수치의 동일함과 표현의 정밀성 차이를 이용한 교묘한 문장 구성 함정입니다.
(Statement ③ plays with exact ranking terminology vs tied ranks.)
[세트 3] 스마트폰 브랜드별 시장 점유율 (Smartphone Market Share by Brand)
[한국어 원문] 다음은 '2024년과 2025년 스마트폰 브랜드별 시장 점유율'에 대한 자료이다. 이 내용을 옳게 이해한 것은?
[English Translation] The following is data regarding 'Smartphone Market Share by Brand in 2024 and 2025.' Which of the following correctly understands this content?
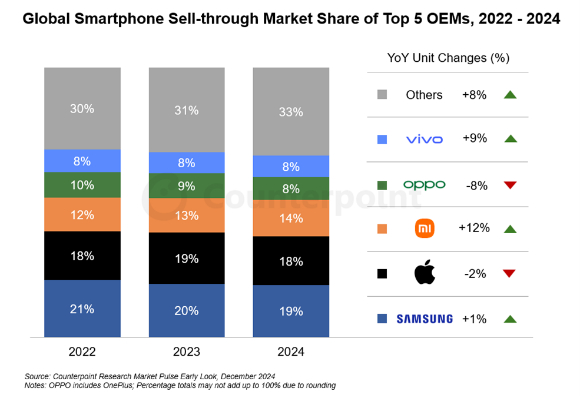
① 삼성브랜드의 점유율은 2023년에 비해 2024년에 10% 증가했다.
(Samsung brand's market share increased by 10% in 2024 compared to 2023.)
② 애플브랜드는 2023년과 2024년 모두 시장 점유율 1위를 유지했다.
(Apple brand maintained 1st place in market share in both 2023 and 2024.)
③ 2024년에는 삼성 브랜드가 샤오미 브랜드보다 점유율이 2배 이상 높았다.
(In 2024, Samsung brand's market share was more than double that of Xiaomi brand.)
④ 오포 Oppo 브랜드는 2024년 대비 점유율이 감소했으나, 순위에는 변화가 없었다.
(Oppo brand's market share decreased compared to 2024, but there was no change in its ranking.)
정답 (Answer): ④
[풀이 / Solution] 특정 브랜드의 점유율 수치가 소폭 감소하였으나 전체 브랜드 내 상대적 순위 위치는 동일하게 유지되었으므로, '순위에는 변화가 없다'는 서술이 정확합니다.
(Although the numerical market share decreased slightly, the relative ranking among all brands remained unchanged, making the statement 'no change in ranking' correct.)
[함정 분석 / Trap Point & Analysis]
• ①번: 점유율 % 증가와 %포인트(%p)의 차이를 혼동시키는 전형적인 수치 연산 함정입니다.
(Statement ① confuses percentage growth rate with percentage point (%p) difference.)
• ②번: 1위와 2위 간 미세한 격차 변화를 간과하게 만들어 잘못된 지속성을 가정하게 하는 함정입니다.
(Statement ② makes test-takers overlook subtle rank shifts between 1st and 2nd place.)
• ③번: 배수 비교(2배 이상 등) 계산 시 실제 비율 수치를 직접 대입해 보지 않으면 착각하기 쉬운 산술 함정입니다.
(Statement ③ is an arithmetic trap when comparing multipliers like 'more than double'.)
학습 영상 (Educational Video Tutorial)
[한국어 원문] TOPIK 그래프 문제를 해결하는 실전 도표 해독법을 영상을 통해 복습해 보세요.
[English Translation] Review practical chart decoding methods for TOPIK graph problems through this video tutorial.
핵심 어휘 정리 (Key Vocabulary Breakdown)
| 어휘 (Vocabulary) | 의미 & 예문 (Meaning & Example) |
|---|---|
| 꾸준히 (Steadily, Consistently) |
의미: 변함없이 계속. 멈추지 않고 계속해서. 예문: 매일 한국어를 꾸준히 공부하면 TOPIK 고득점을 받을 수 있습니다. 연습: 그는 매일 일기를 ( 꾸준히 ) 썼습니다. |
| ~에 가깝다 (Close to, Nearly) |
의미: 어떤 수치나 상태에 거의 다다랐음을 나타내는 표현. 예문: 이 제품의 매출 상승률은 50%에 가깝다. 연습: 조사 대상의 반쯤이라는 의미로 '50%에 ( 가깝다 )'라고 표현합니다. |
| 도표 / 그래프 (Chart / Graph) |
의미: 수치나 통계 자료를 시각적으로 나타낸 표나 그림. 예문: TOPIK 읽기 영역에서는 도표 분석 능력이 핵심입니다. |
TOPIK 출제 핵심 포인트 (TOPIK Core Strategy)
[한국어 원문] TOPIK 읽기 및 쓰기(53번) 그래프 문제에서 오답을 유도하는 대표적인 3가지 구조를 이해해야 합니다.
[English Translation] You must understand the 3 representative structural patterns that trigger wrong answers in TOPIK reading and writing (Q53) graph problems.
문화 설명 (Culture Note)
한국 대학생의 '알바' 문화와 직장인 스트레스 (Part-Time Job & Office Culture in Korea)
[한국어 원문] 한국에서는 대학생들의 아르바이트를 줄여서 '알바'라고 부릅니다. 카페, 편의점, 학원 강사 등 다양한 알바 경험은 사회생활의 첫걸음으로 여겨집니다. 한편 직장인 설문조사에서 항상 높게 나타나는 '업무량'과 '인간관계' 스트레스는 한국의 조직 문화와 밀접한 관련이 있습니다.
[English Translation] In Korea, college students' part-time jobs are abbreviated as 'Alba' (알바). Various part-time job experiences such as cafes, convenience stores, and tutoring are considered the first step into professional life. On the other hand, 'workload' and 'interpersonal relations' stress, which always rank high in employee surveys, are closely related to Korean organizational culture.
핵심 문법 설명 (Grammar Points)
1. ~에 비해 / ~와 비교하여 (Compared to, In comparison with)
[한국어 원문] 둘 이상의 대상을 놓고 그 차이점이나 공통점을 말할 때 사용하는 필수 비교 문법입니다.
[English Translation] An essential comparative grammar structure used when expressing differences or similarities between two or more items.
• 작년에 비해 올해 매출이 15% 상승했습니다.
(Sales increased by 15% this year compared to last year.)
• 지난달과 비교하여 고객 문의가 크게 줄었습니다.
(Customer inquiries decreased significantly in comparison with last month.)
2. ~포인트 (%p / Percentage Points)
[한국어 원문] 비율 간의 차이를 직접 나타낼 때 사용하며, 단순히 %로 표현하는 것과 구별됩니다.
[English Translation] Used to indicate the direct difference between percentages, distinguished from simple percentage growth.
• 점유율이 20%에서 25%로 5포인트 상승했습니다.
(The market share increased by 5 percentage points from 20% to 25%.)
핵심 요약 (Summary)
[한국어 원문] 그래프 문제를 풀 때는 다음 3가지를 반드시 체크하세요!
[English Translation] When solving graph problems, always check these 3 points!
- 1. Y축 단위 확인: 인원수(명)인가, 비율(%)인가?
(Check Y-axis unit: Absolute count or percentage?) - 2. 비교 서술어 주의: '증가했다'와 '가장 높다'를 구별할 것.
(Watch comparative verbs: Distinguish 'increased' from 'highest'.) - 3. 모호한 주관적 단어 경계: '절반에 가깝다', '급격히' 등 수치검증 필수.
(Beware of subjective words: Always verify numbers for phrases like 'close to half'.)
쉐도잉 연습 (Shadowing Practice)
[한국어 소리 내어 읽기]
"작년에 비해 올해 카페 아르바이트 비율이 5포인트 증가했습니다."
[Pronunciation Guide / 발음] [작년에 비해 올해 카페 아르바이트 비율이 오포인트 증가헸씀니다]
[English Meaning] "Compared to last year, the proportion of cafe part-time jobs increased by 5 percentage points this year."
관용구 & 자주 하는 실수 (Native Expressions & Common Mistakes)
💡 현지인 관용 표현 (Native Expression)
"눈대중으로 보다" (To judge by eye / estimate casually)
[한국어 원문] 그래프 문제를 눈대중으로만 보면 숫자의 함정에 빠지기 쉽습니다. 정확한 숫자를 확인하세요.
[English Translation] If you only judge graph problems by eye, it is easy to fall into number traps. Always check the exact figures.
⚠️ 자주 하는 실수 (Common Mistake)
❌ 실수: 10%에서 15%로 늘어난 것을 "5% 증가했다"라고만 말함.
⭕ 올바른 표현: "5%포인트(%p) 증가했다" 또는 "기존 대비 50% 증가했다."
(Confusing a 5 percentage point increase with a 5% relative increase.)
읽기 검증 & 말하기 연습 (Reading Check & Speaking Practice)
[말하기 미션 / Speaking Practice Task]
[한국어 질문] 여러분 나라에서 대학생들에게 가장 인기 있는 아르바이트는 무엇이며, 그 이유는 무엇인가요?
[English Question] What is the most popular part-time job for college students in your country, and what is the reason?
[가이드 답변 예시] "우리 나라에서는 카페 알바가 가장 인기가 있습니다. 근무 환경이 깨끗하기 때문입니다."
(In my country, cafe part-time jobs are most popular because the working environment is clean.)
복습 퀴즈 (Review Quiz)
Q. 다음 빈칸에 들어갈 가장 알맞은 표현을 고르세요.
"지난해 20%였던 비율이 올해 25%가 되었으므로, 비율이 5( ) 상승했다고 볼 수 있다."
핵심 요약 노트 (Key Takeaways)
- TOPIK 그래프의 핵심: 수치(Absolute numbers)와 비율(Percentages)의 차이를 정확히 구분한다.
- 비교 문법: '~에 비해 / ~와 비교하여'를 활용하여 변화량을 명확히 표현한다.
- 함정 방지: '절반에 가깝다', '모두 증가했다' 등 지나치게 일반화되거나 모호한 선지는 주의한다.
📢 SUPER REAL KOREAN 매일 무료 학습 구독
[한국어] 매일 5분 투자로 TOPIK 6급 합격과 실전 한국어 실력을 완성하세요!
[English] Achieve TOPIK Level 6 and real-life Korean proficiency with just 5 minutes a day!
구독하기 (Subscribe CTRL+D) TOPIK 허브 바로가기

댓글
댓글 쓰기